前回より +4
Keep the flow of making, not just the finished piece.
Record the hidden work behind each piece - time, actions, revisions, and workflow stats - then turn it into dashboards, proof pages, and shareable certificates.
Get the app Mac App Store
 Microsoft Store
Microsoft StoreOfficial Mac App Store and Microsoft Store badges. Capture and Apple Watch options are listed below.
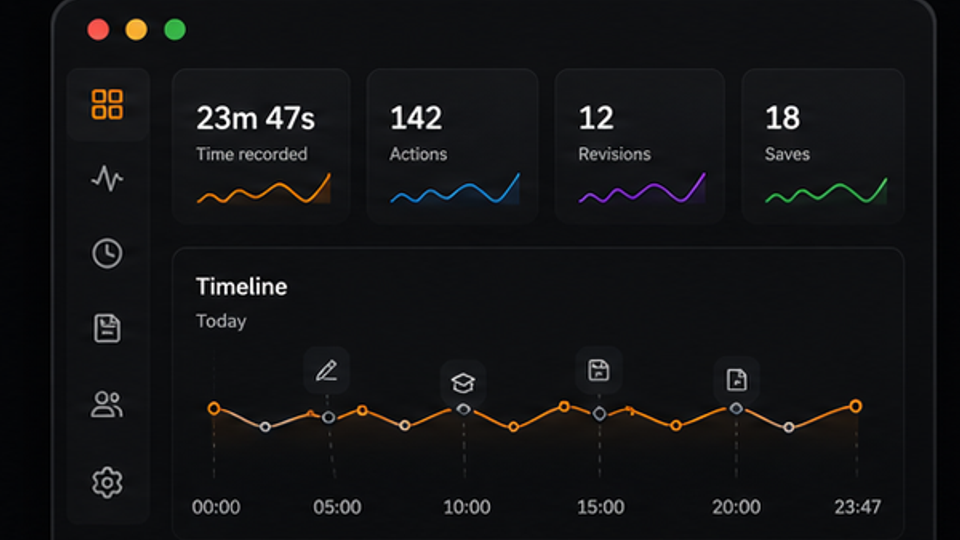
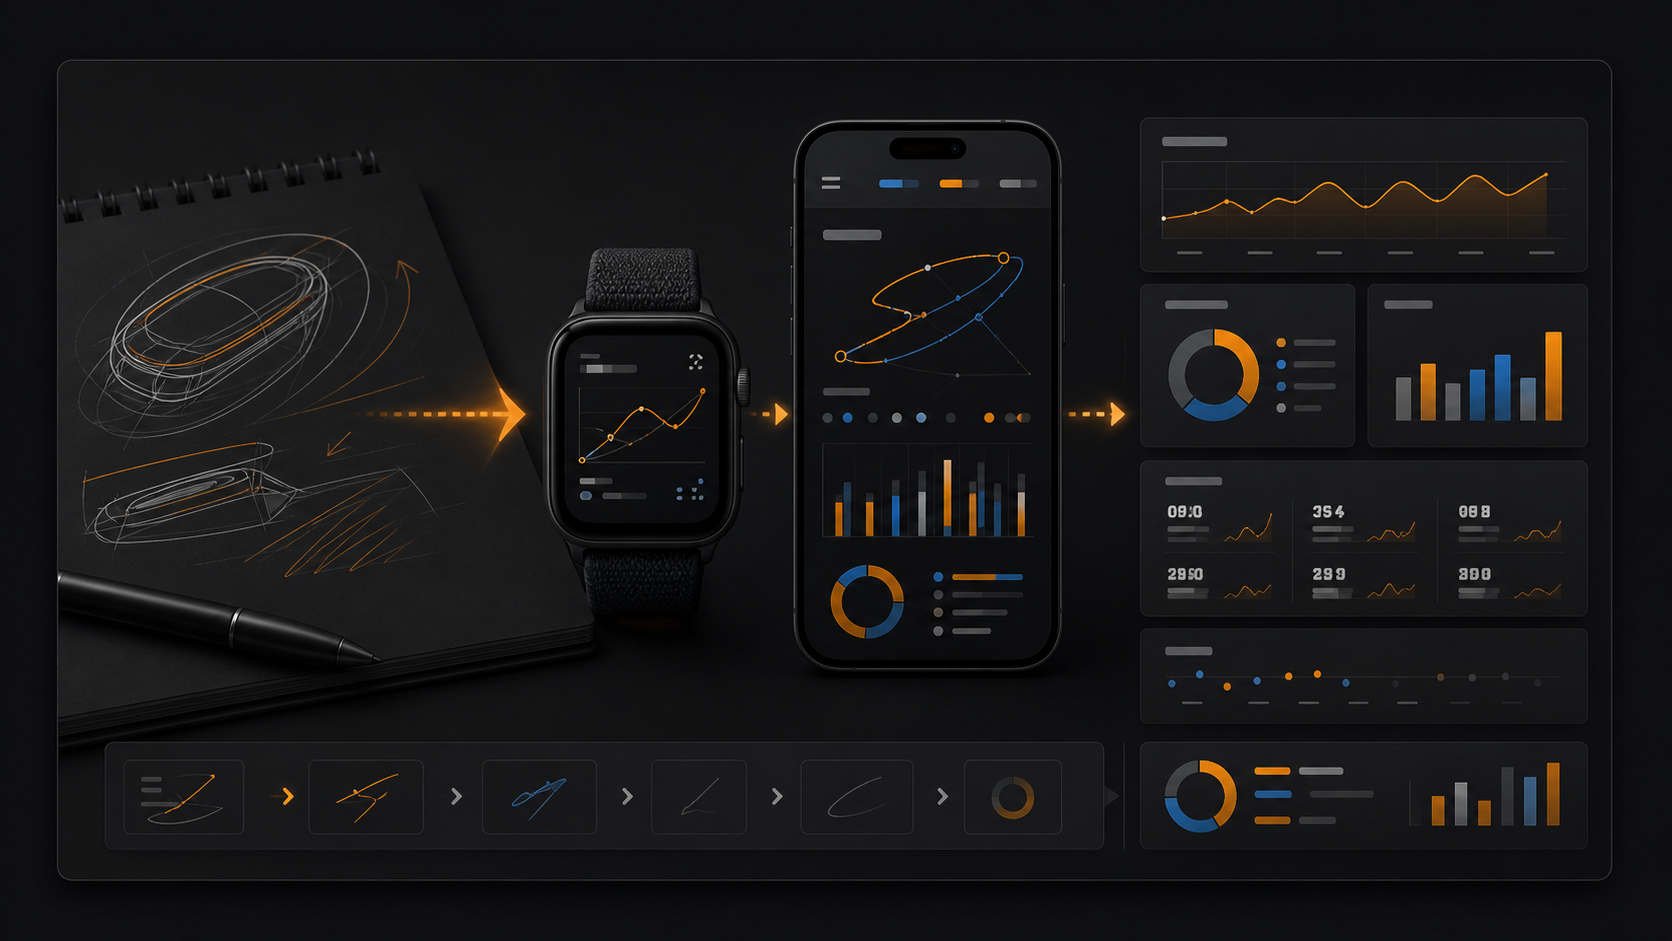
Sample DashboardPreview
See your creative process as measurable work.
Track time, revisions, tool actions, stroke activity, and output quality signals in one dashboard.
Key metricsSee the current picture
View all detailed metrics4 artworks finished100%
Comparison focusSee the gap from the machine baseline
Farther outside means farther from the machine-like patternActualMachine baseline
Overall positionTop 53%
14 artworks / 18.7h
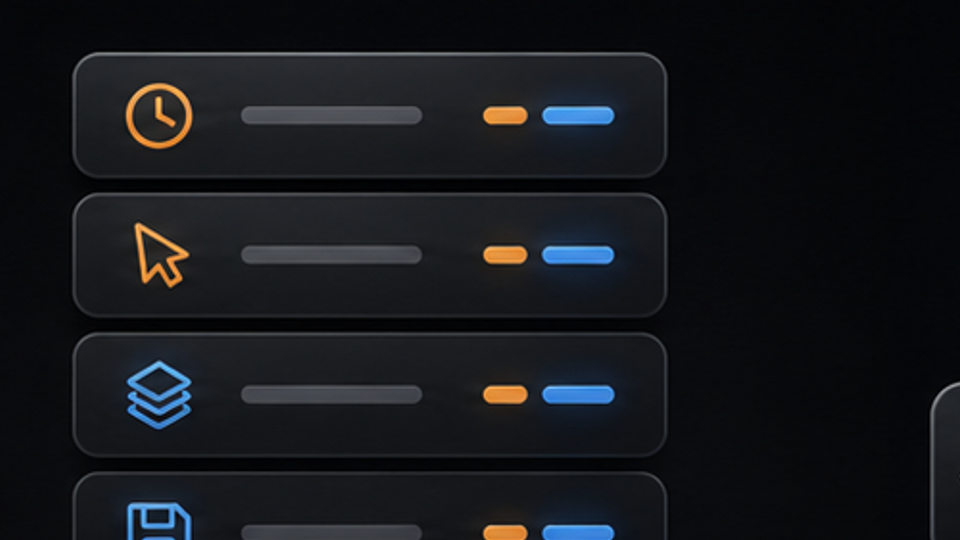
Activity breakdownFrequently used operations
View all detailed metricsDrawing activity
View detailsHow you create on the canvas.
Editing behavior
View detailsHow you refine and adjust.
Canvas / navigation
View detailsHow you move and work in your space.
Output / quality
View detailsHow you finish and deliver.
Overall timeline
Compare total operations and stroke amount across 4 artworks with average, max, and min lines.Based on 4 artworks
Total operationsStroke amount
0%25%50%75%100%
What you can create from your process
Use the same production record privately, publicly, as a verifiable PDF, or as a compact portfolio signal.
Private dashboard
Review your own work habits, time, actions, and revision patterns.
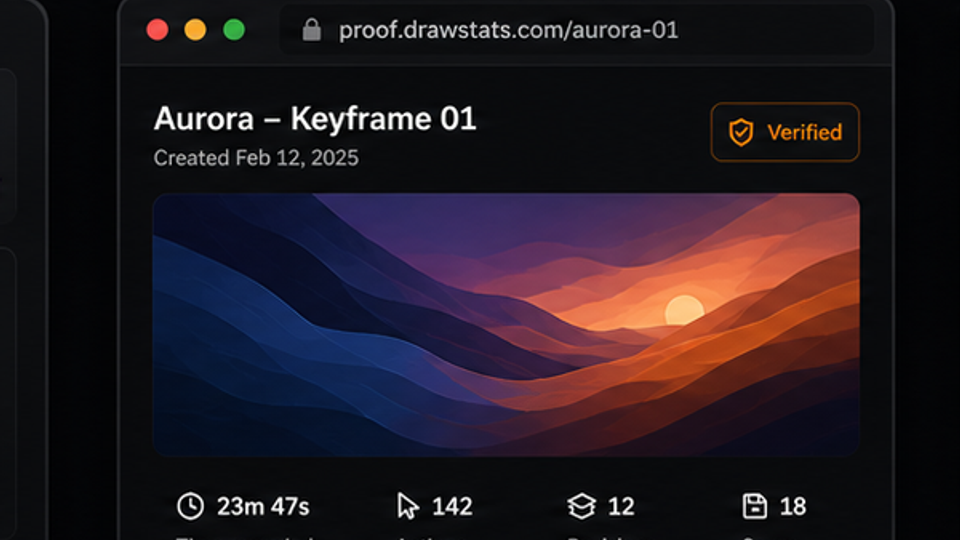
Public proof page
Share selected process stats without exposing private project files.
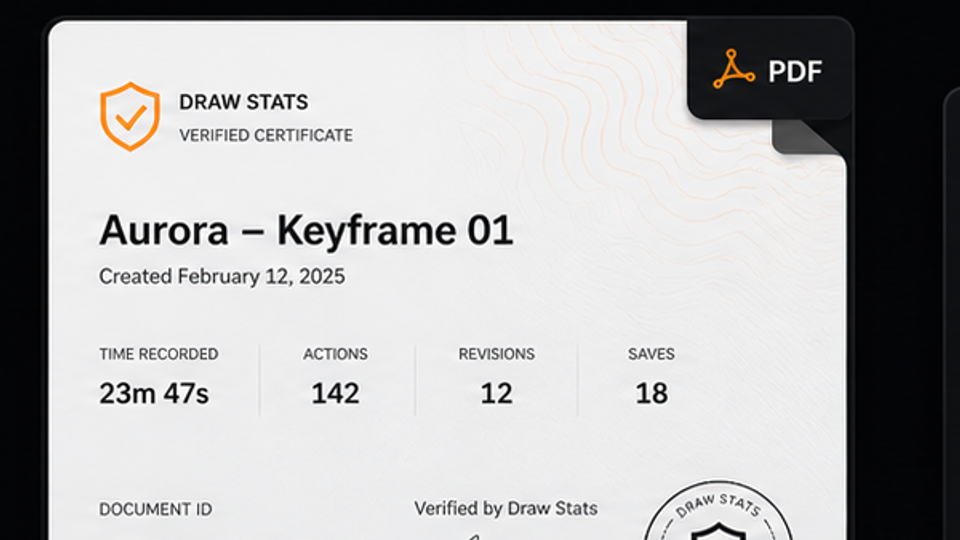
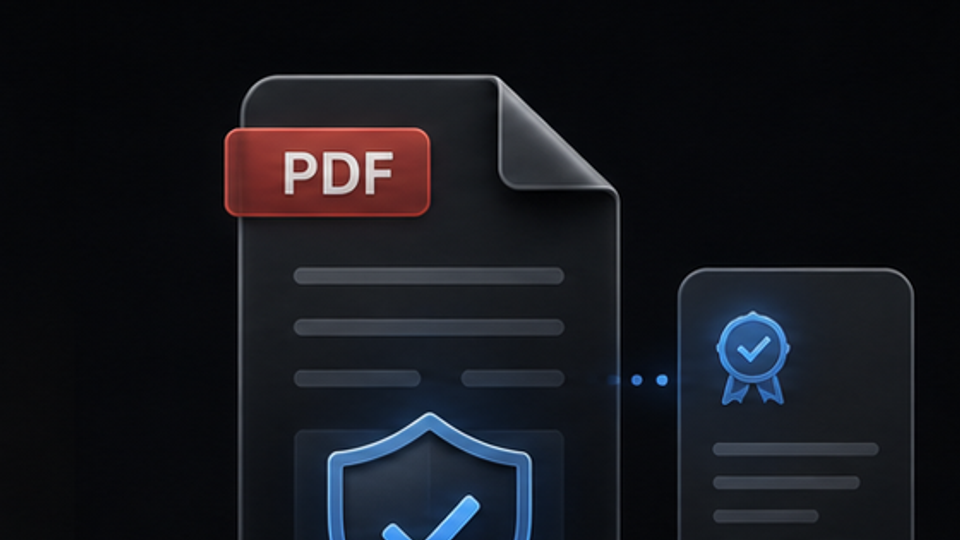
Verified PDF certificate
Export a branded proof document that can be checked later.
Portfolio embed
Add process stats to your profile, portfolio, or commission page.
Apple Watch supportRecord the sessionApple Watch captures wrist-origin session signals while you keep drawing on paper or canvas. iPhone keeps contextThe iPhone companion keeps artwork, session, and account context together without exposing private source files. Flows into proofAggregated Watch-origin stats can sit beside digital work stats when you create shareable proof.
Apple Watch turns analog drawing into stats.
Pair the iPhone companion with Apple Watch to capture analog sessions as stroke state, stroke count, amount, elapsed time, and Watch-origin stats alongside your digital work.
Download Draw Stats
Choose your platform to get started.
Works as a pairMac App StoreDownload Capture
Draw Stats for Mac + Capture
Capture records your drawings on Mac with cryptographic integrity and sends them to Draw Stats for Mac. Draw Stats analyzes, verifies, and generates tamper-evident proofs.
- 1Capture on Mac
- 2Analyze in Draw Stats
- 3Generate shareable proof
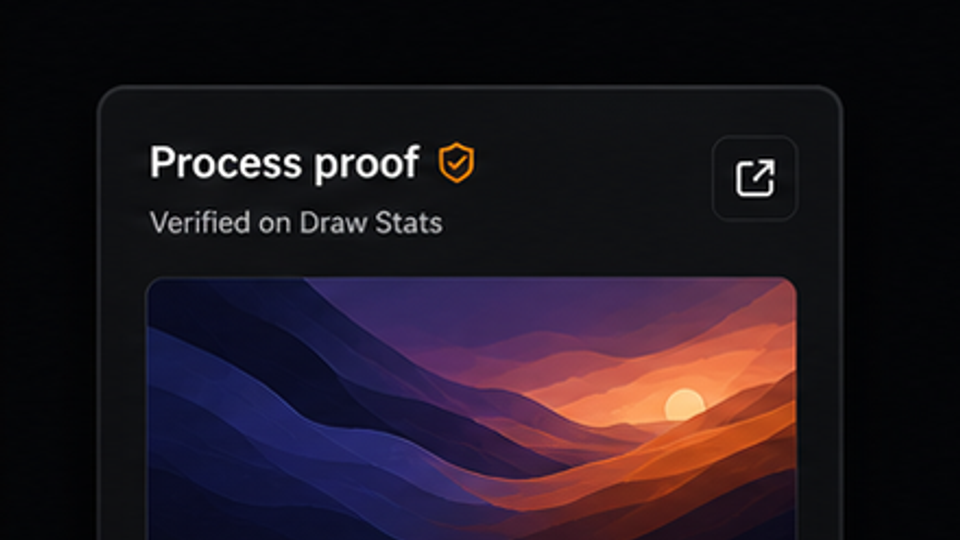
Shareable proof
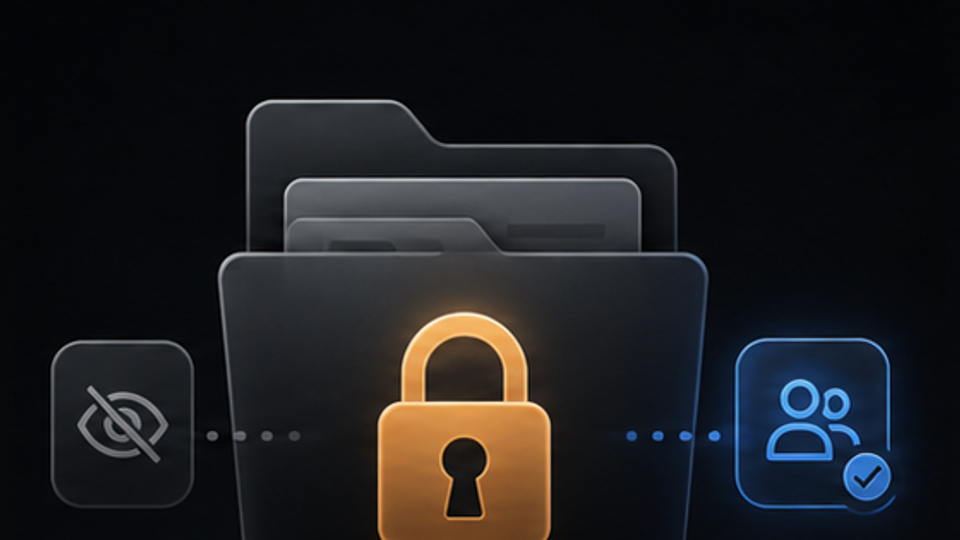
Share proof without sharing private files.
Your artwork files stay yours. Draw Stats focuses on process metadata - time, actions, revisions, and workflow signals - so clients, schools, or collaborators can check selected evidence later.
Selected stats onlyChoose process signals to show without opening the whole project.
Verification pageClients or collaborators can check a received PDF later.
No source filesShare selected process stats, not private source files.
Not an AI detectorDraw Stats shows consistent process evidence; it does not judge whether art is human or AI-made.
Creator Statistics Proof
Issued by Draw Stats- Subject
- Twilight Garden / Example creator
- Issued
- 2026-05-20
Strokes17,472
Active time18h 40m
Reliability91
Signatureds-proof-7f24c9a1
Choose the path that matches how public your proof needs to be.
Start with the tracker, then upgrade when public proof, portfolio use, or team review becomes part of the workflow.
Pricing plans use columns when they fit in one row, and switch to a horizontal carousel on narrower screens. Drag the cards or use the side buttons.
Trust and privacy basics
A production record is useful only when creators can control what leaves the workspace.
What data is recorded?
Process metadata such as time, actions, revisions, saves, and workflow signals.
Can I keep works private?
Yes. Share selected stats without exposing private project files.
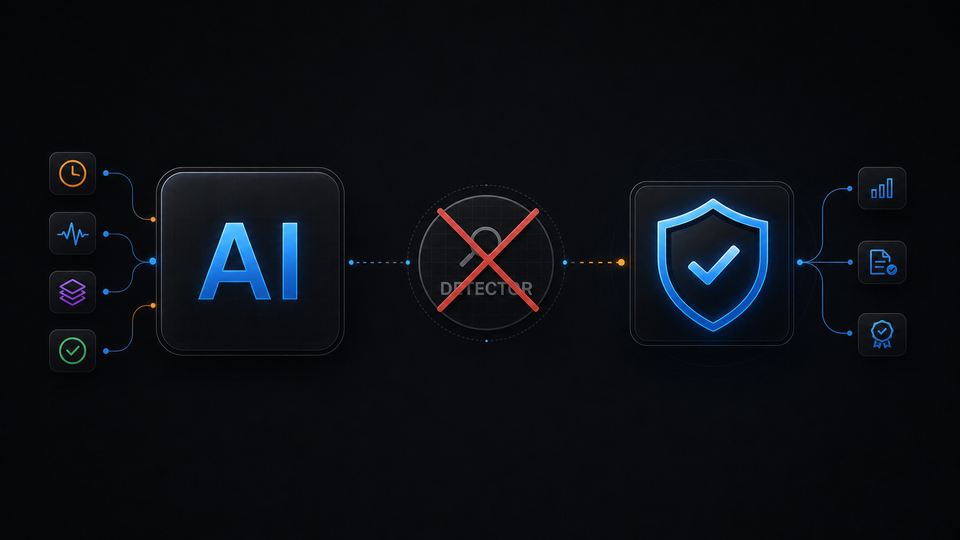
Is this an AI detector?
No. Draw Stats does not claim to judge whether art is human or AI-made.
Can clients verify PDFs?
A received proof PDF can be checked on the Draw Stats verification page.
Get started
Decide your first step right here.
Start free, connect your desktop, and keep the same flow until the first production log appears.